Global Workforce GlossaryYear to date
Related Terms
Floating Holiday
Tax Identification Number
W2 Employee
Holiday Pay
Form I-9
Year-to-Date (YTD) is a critical financial and HR metric that tracks performance from the start of a period, usually the calendar or fiscal year-to the present.
For global executives, understanding YTD enables precise workforce cost management, compliance reporting, and financial analysis across regions.
- What does “Year to Date (YTD)” mean?
- How is YTD calculated with an example?
- What are YTD hours, earnings, returns, and dividends?
- When does YTD start?
- How do you use YTD in reporting or analysis?
- YTD vs. MTD: what’s the difference?
- Calendar Year to Date vs. Fiscal Year to Date: what’s the difference?
- Who uses Year to Date reports?
- What are the benefits of YTD reporting?
- How do you calculate YTD returns or revenue?
- Is Year to Date gross or net?
- Example
What does “Year to Date (YTD)” mean?
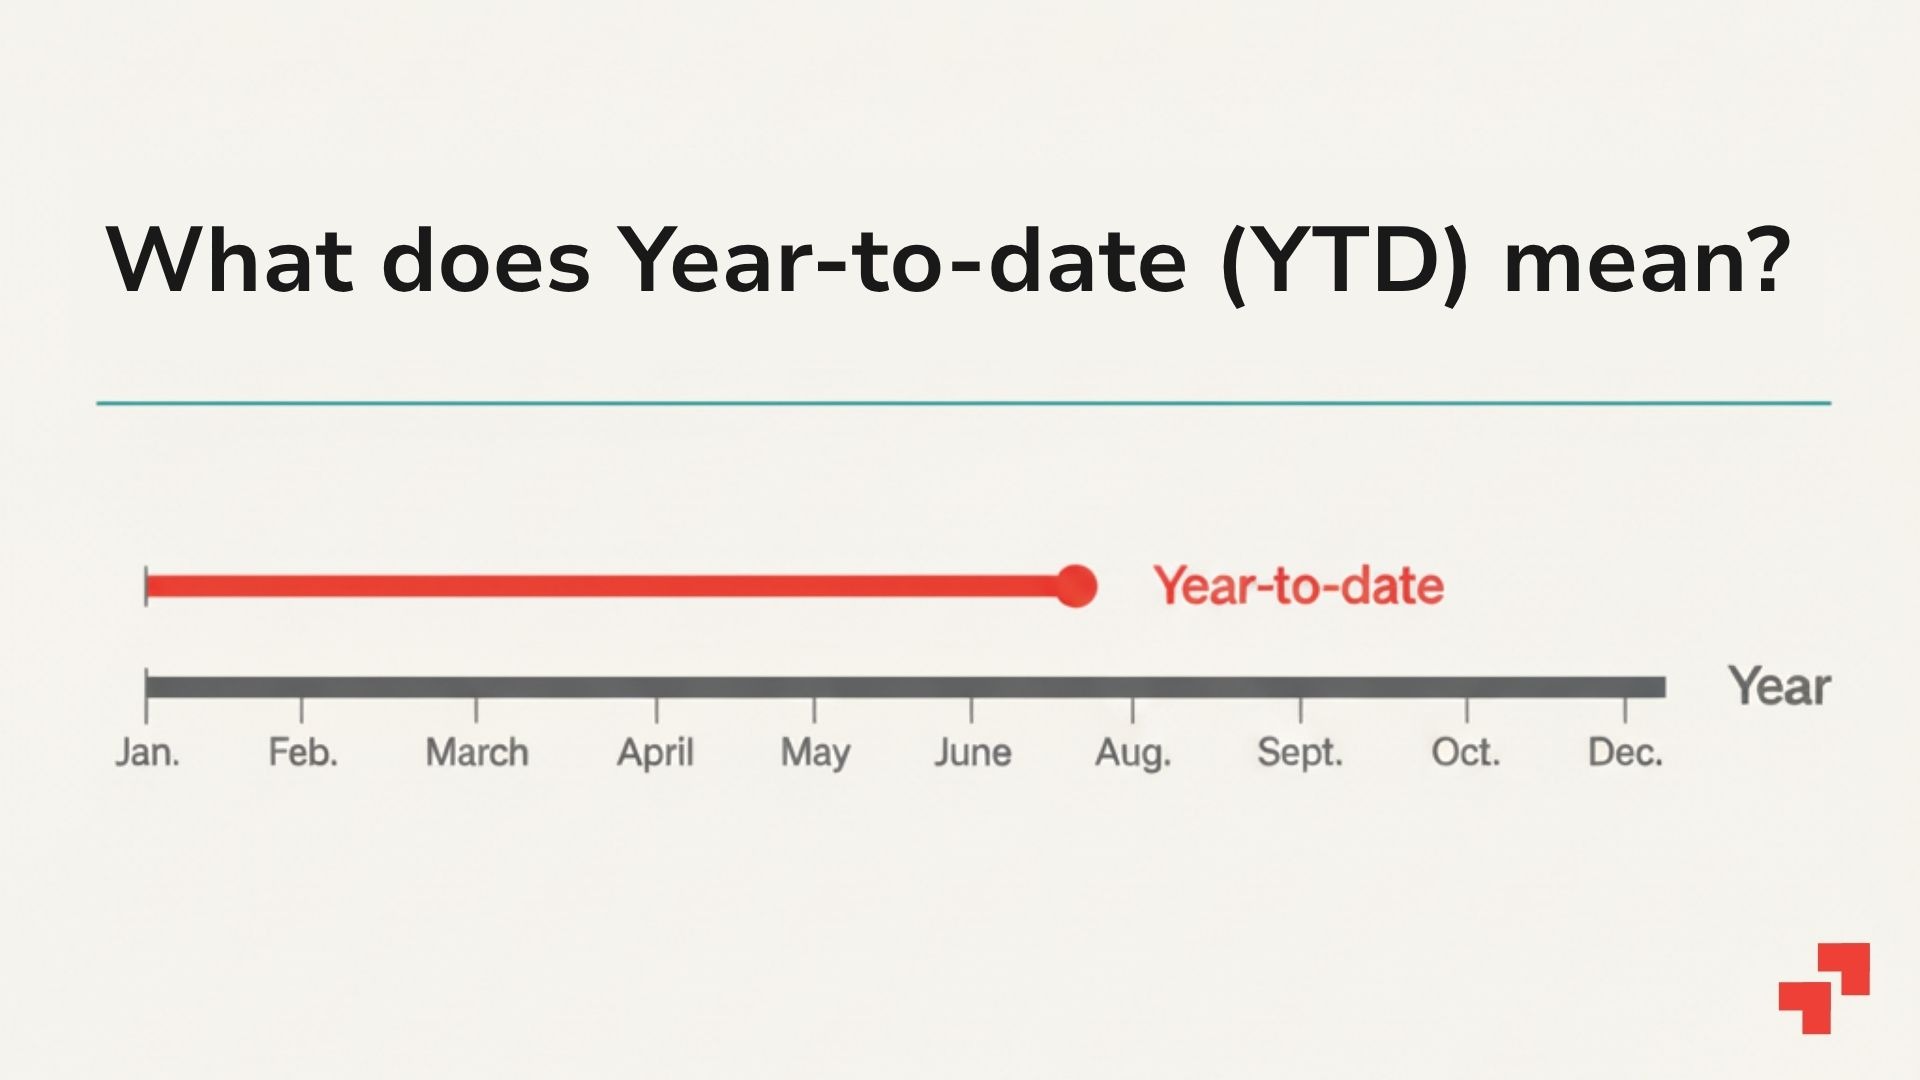
YTD measures cumulative totals from the start of the year to a specific date. YTD stands for “Year to Date” which refers to the total accumulated from the beginning of the calendar or fiscal year up to the present, and the sum of financial or performance metrics over this period. YTD refers to a key metric in financial statements, payroll, and business analysis, helping track progress and benchmark performance.
It applies to earnings, taxes, expenses, revenue, returns, and dividends. YTD provides a snapshot of performance over time, allowing executives to track progress against budgets, forecast trends, and ensure compliance with tax or labor regulations.
For example, According to the IRS, a YTD salary report or pay stub shows all earnings and deductions, including both gross pay and net pay, from January 1 to the current pay period.

How is YTD calculated with an example?
YTD is calculated by summing all relevant data points from the start of the year to the chosen date.
On a payslip, YTD earnings equal the total gross pay or gross wages paid so far before deductions; cumulative earnings are tracked from the starting year value or beginning values up to the most recent pay period. Deductions and contributions are aggregated similarly, reflecting totals from the beginning values to the recent pay period.
For instance, if a monthly gross salary is $5,000 and four pay periods have passed, YTD earnings are $20,000. YTD = Sum of values from Jan 1 (the starting year value) x Current date (the most recent pay period).
When calculating YTD, you perform ytd calculations by summing all relevant amounts from the beginning values or starting year value to the current or most recent pay period to calculate year totals.
What are YTD hours, earnings, returns, and dividends?
- Hours: Total work hours logged from year start. Example: 1,600 YTD hours by April.
- Earnings: Total income earned, including all employee earnings and employee’s earnings up to the current date. Example: $40,000 YTD salary. Net income is also tracked year to date to assess overall profitability.
- Returns: Investment gains/losses accumulated. Example: 12% YTD stock return. YTD investment returns are key for measuring portfolio performance over the year.
- Dividends: Total payouts received. Example: $1,200 YTD dividends.
- YTD Sales: Total sales revenue generated from the beginning of the year to date. Example: $500,000 YTD sales revenue.
These metrics help executives benchmark performance, compliance, and operational efficiency. YTD figures such as employee earnings, investment returns, net income, and sales revenue are often summarized in an income statement for comprehensive financial analysis.
When does YTD start?
The ‘starting date’ or ‘period starting’ is critical for YTD calculations, as it marks the beginning of the timeframe for measuring performance. YTD starts at the beginning of a defined period: either January 1 for the current calendar year or the first day of a company’s fiscal year (e.g., April 1).
The choice of ‘dates’, including both the starting date and the ‘end date’, determines the YTD period, and using the current calendar year is common for standardisation. The start date determines all cumulative calculations for payroll, taxes, revenue, and reporting. Correctly identifying the start ensures accurate trend analysis, compliance, and forecasting for decision-making across multiple jurisdictions.
How do you use YTD in reporting or analysis?
YTD provides a snapshot of cumulative performance for evaluating business performance, company’s performance, and financial performance using YTD data. These metrics are key areas assessed through YTD analysis to support trend analysis, budgeting, forecasting, and compliance.
YTD performance, YTD analysis, and YTD insights help executives in tracking progress, identifying business trends, and making strategic adjustments throughout the year. Executives use YTD to compare current progress against annual goals, assess variance in payroll or revenue, and make informed staffing, investment, or cost decisions.
Financial statements and YTD data are essential tools for assessing financial health and making informed decisions. YTD reporting facilitates cross-regional comparisons and helps mitigate risk of tax underpayment, budget overshoot, or compliance violations.
YTD vs. MTD: What’s the difference?
YTD (Year to Date) covers cumulative data from the start of the year to a given date, while MTD (Month to Date) tracks data only for the current month, making MTD a shorter period compared to YTD. Both YTD and MTD are types of time period metrics used in financial analysis to measure performance over defined spans.
For example, in May, MTD earnings = May salary only, YTD earnings = Jan–May cumulative salary. YTD provides broader trend insights, whereas MTD captures short-term performance for operational adjustments.
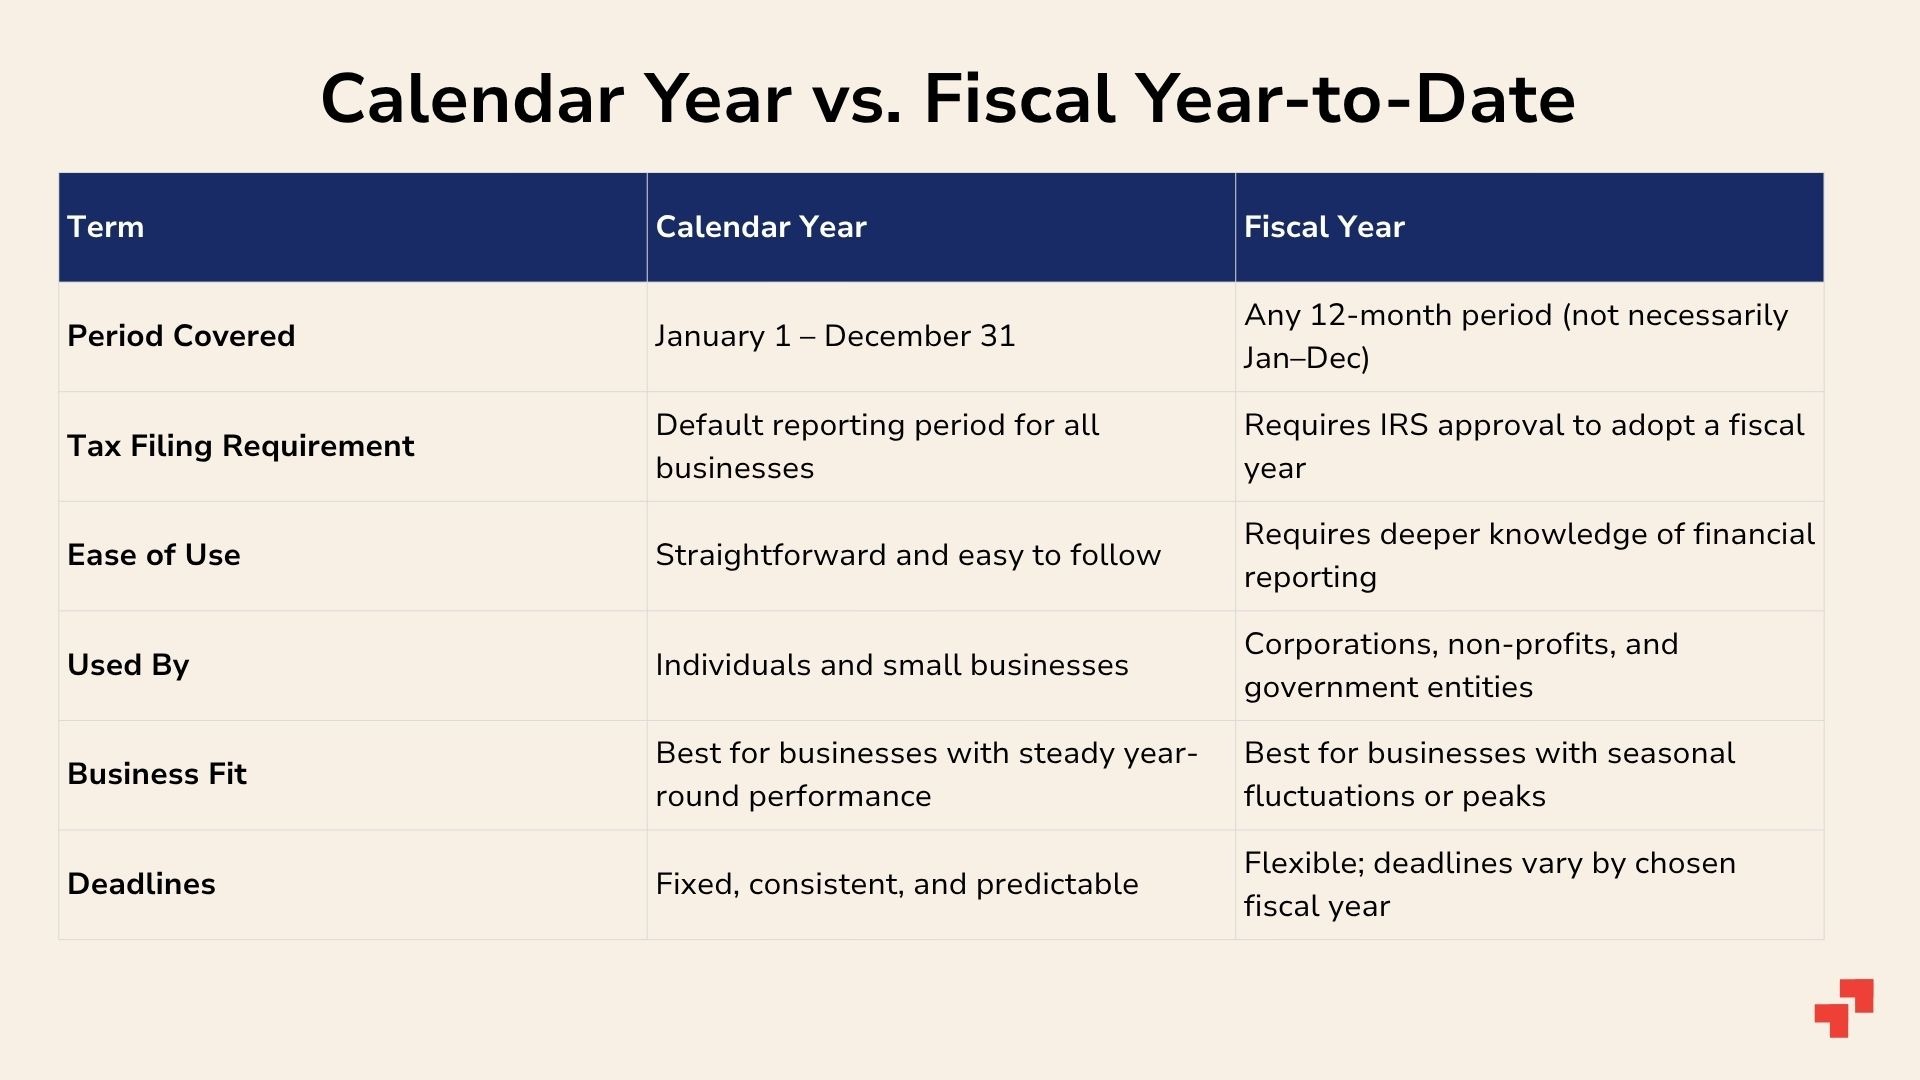
Calendar Year to Date vs. Fiscal Year to Date: What’s the difference?
Calendar YTD starts January 1, while Fiscal YTD starts the company’s fiscal year (e.g., July 1). Both track cumulative totals to the present date but differ in start point. The ‘ytd period’ is defined by the selected start and end dates for each reporting cycle.
Example: If fiscal year begins July 1, YTD earnings on September 30 = sum from July 1 → September 30, not Jan 1 → September 30. Comparing YTD figures across prior periods, previous periods, or the same period in past years helps assess performance trends. Using the same date as a reference point ensures accurate year-over-year comparisons. Correct interpretation ensures accurate reporting, tax compliance, and internal benchmarking.

Who uses Year-to-Date reports?
YTD reports are essential for CFOs, CHROs, finance teams, payroll specialists, auditors, and investors. They guide payroll verification, tax compliance, budget management, revenue tracking, and investment performance analysis. Global companies rely on YTD reports to consolidate cross-country data, monitor trends, and support strategic decision-making.
YTD reports are also critical for financial planning, managing the annual budget, and leveraging real time data for timely decision-making. Without YTD, executives risk misaligned budgets, compliance errors, and poor forecasting accuracy.
What are the benefits of YTD Reporting?
YTD reporting provides transparency, accuracy, and actionable insights. Benefits include trend tracking, early variance detection, payroll and tax compliance, investment performance monitoring, and strategic planning.
Key outputs of YTD reporting include ytd expenses and ytd information, which support compliance, budgeting, and financial planning. Accurate YTD reporting also simplifies the preparation of year end forms for payroll and tax compliance.
Executives can identify patterns, anticipate cash flow needs, and benchmark against targets. YTD reduces errors in payroll and financial reporting while enhancing confidence in data-driven decisions, especially for cross-border operations with multiple currencies and compliance requirements.
How do you calculate YTD returns or revenue?
YTD revenue = Sum of all revenue from the start of the year to the current date.
Example: Company earns $1M each month; by April, YTD revenue = $4M. The YTD formula for revenue is: YTD revenue = Total revenue from January 1 to the present day.
YTD returns for investments = (Current value – Starting value + Dividends) ÷ Starting value × 100.
Example: $12,000 current value – $10,000 initial investment + $200 dividends ÷ $10,000 = 22% YTD return.
The YTD formula for investment returns is: YTD return = [(Current value – Starting value + Dividends) ÷ Starting value] × 100, calculated up to the present day.
For payroll, YTD net pay is a key metric, calculated as the total net earnings (after taxes and deductions) paid to an employee from the start of the year to the present day.
YTD calculations are also useful for tracking tuition payments in educational institutions, aligning financial reporting with the timing of tuition revenue.
This enables executives to track performance against annual targets and adjust strategy promptly.
Is the Year to Date gross or net?
YTD can represent either gross or net figures, depending on context. On payslips and pay stubs, YTD gross = total earnings before deductions; YTD net = take-home pay after taxes, benefits, and contributions.
Pay stubs display both gross and net YTD figures, showing cumulative earnings and other YTD data for employee reference, which helps with tax, payroll, and compliance purposes.
For revenue, YTD gross = total sales; YTD net = revenue minus refunds, discounts, or allowances. Clear distinction ensures accurate reporting, compliance, and executive decision-making.
Example Scenario
Imagine a US-based company expanding to Germany. Payroll for three months: Jan $50k, Feb $55k, Mar $53k. YTD gross payroll = $158k.
The HR team uses this YTD figure to assess tax withholdings, plan cash flow, and benchmark against US operations. Simultaneously, finance calculates YTD net earnings to forecast remaining budget for the fiscal year.
By comparing YTD figures across regions, executives can adjust hiring, compensation, and compliance strategies proactively, minimising risk and maximising efficiency. Executives also leverage YTD figures to identify business trends, support tracking progress against budgets and forecasts, and gain YTD insights that enable more informed and proactive decision-making.
Hire the Best Talent, Anywhere


